Introduction to metabolomics
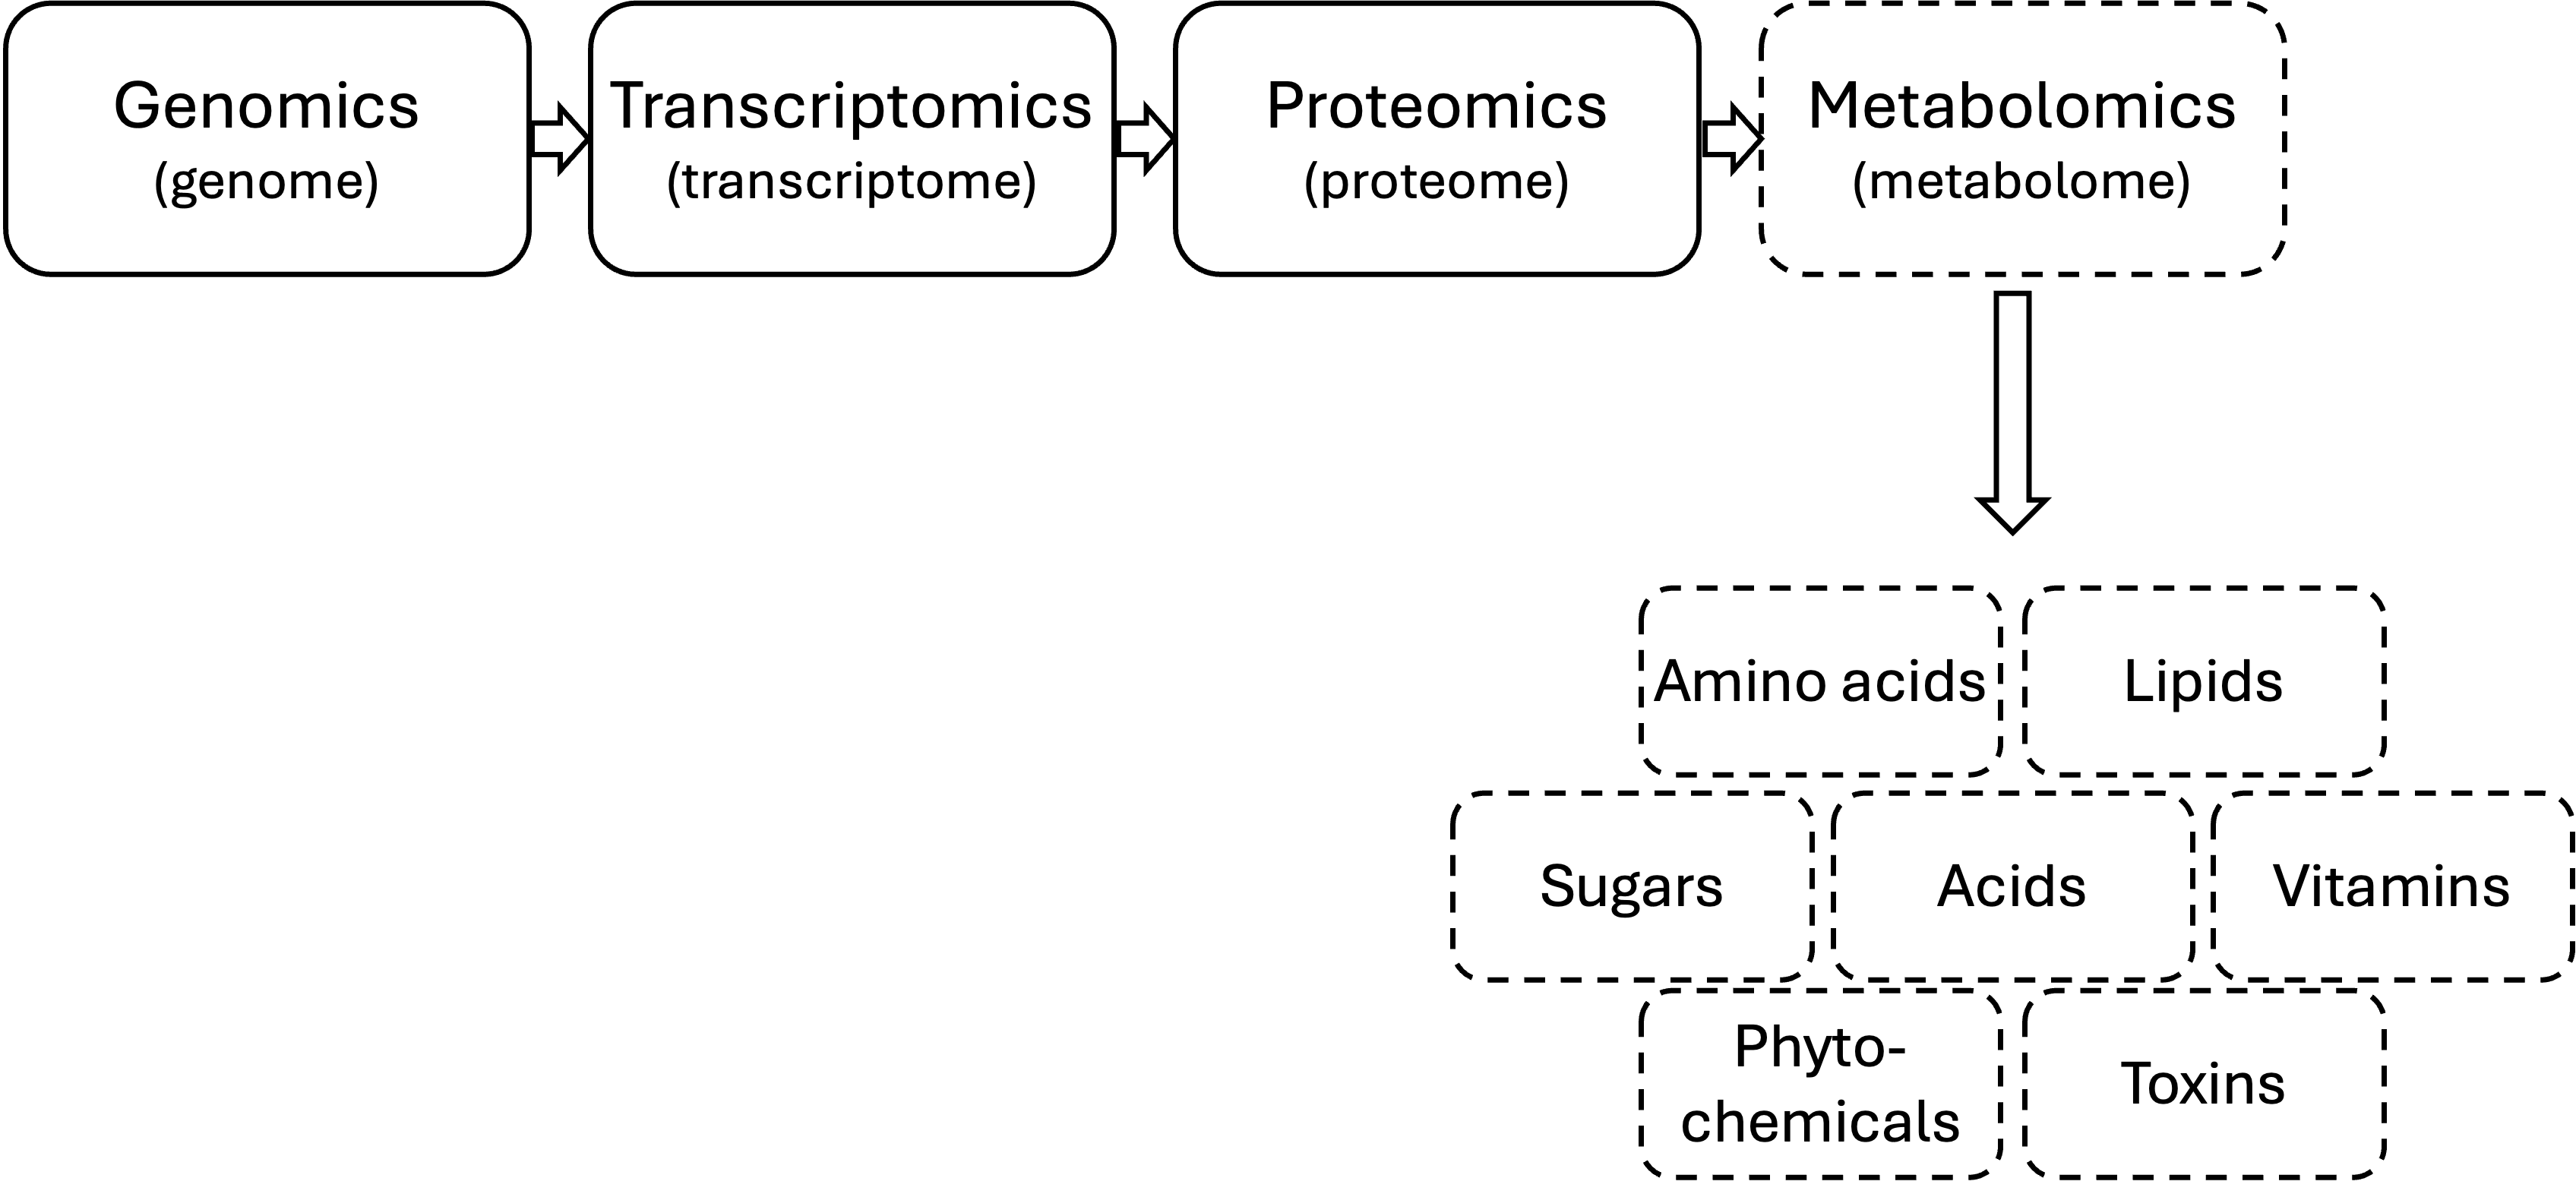
Metabolites are the downstream products of the system biology cascade
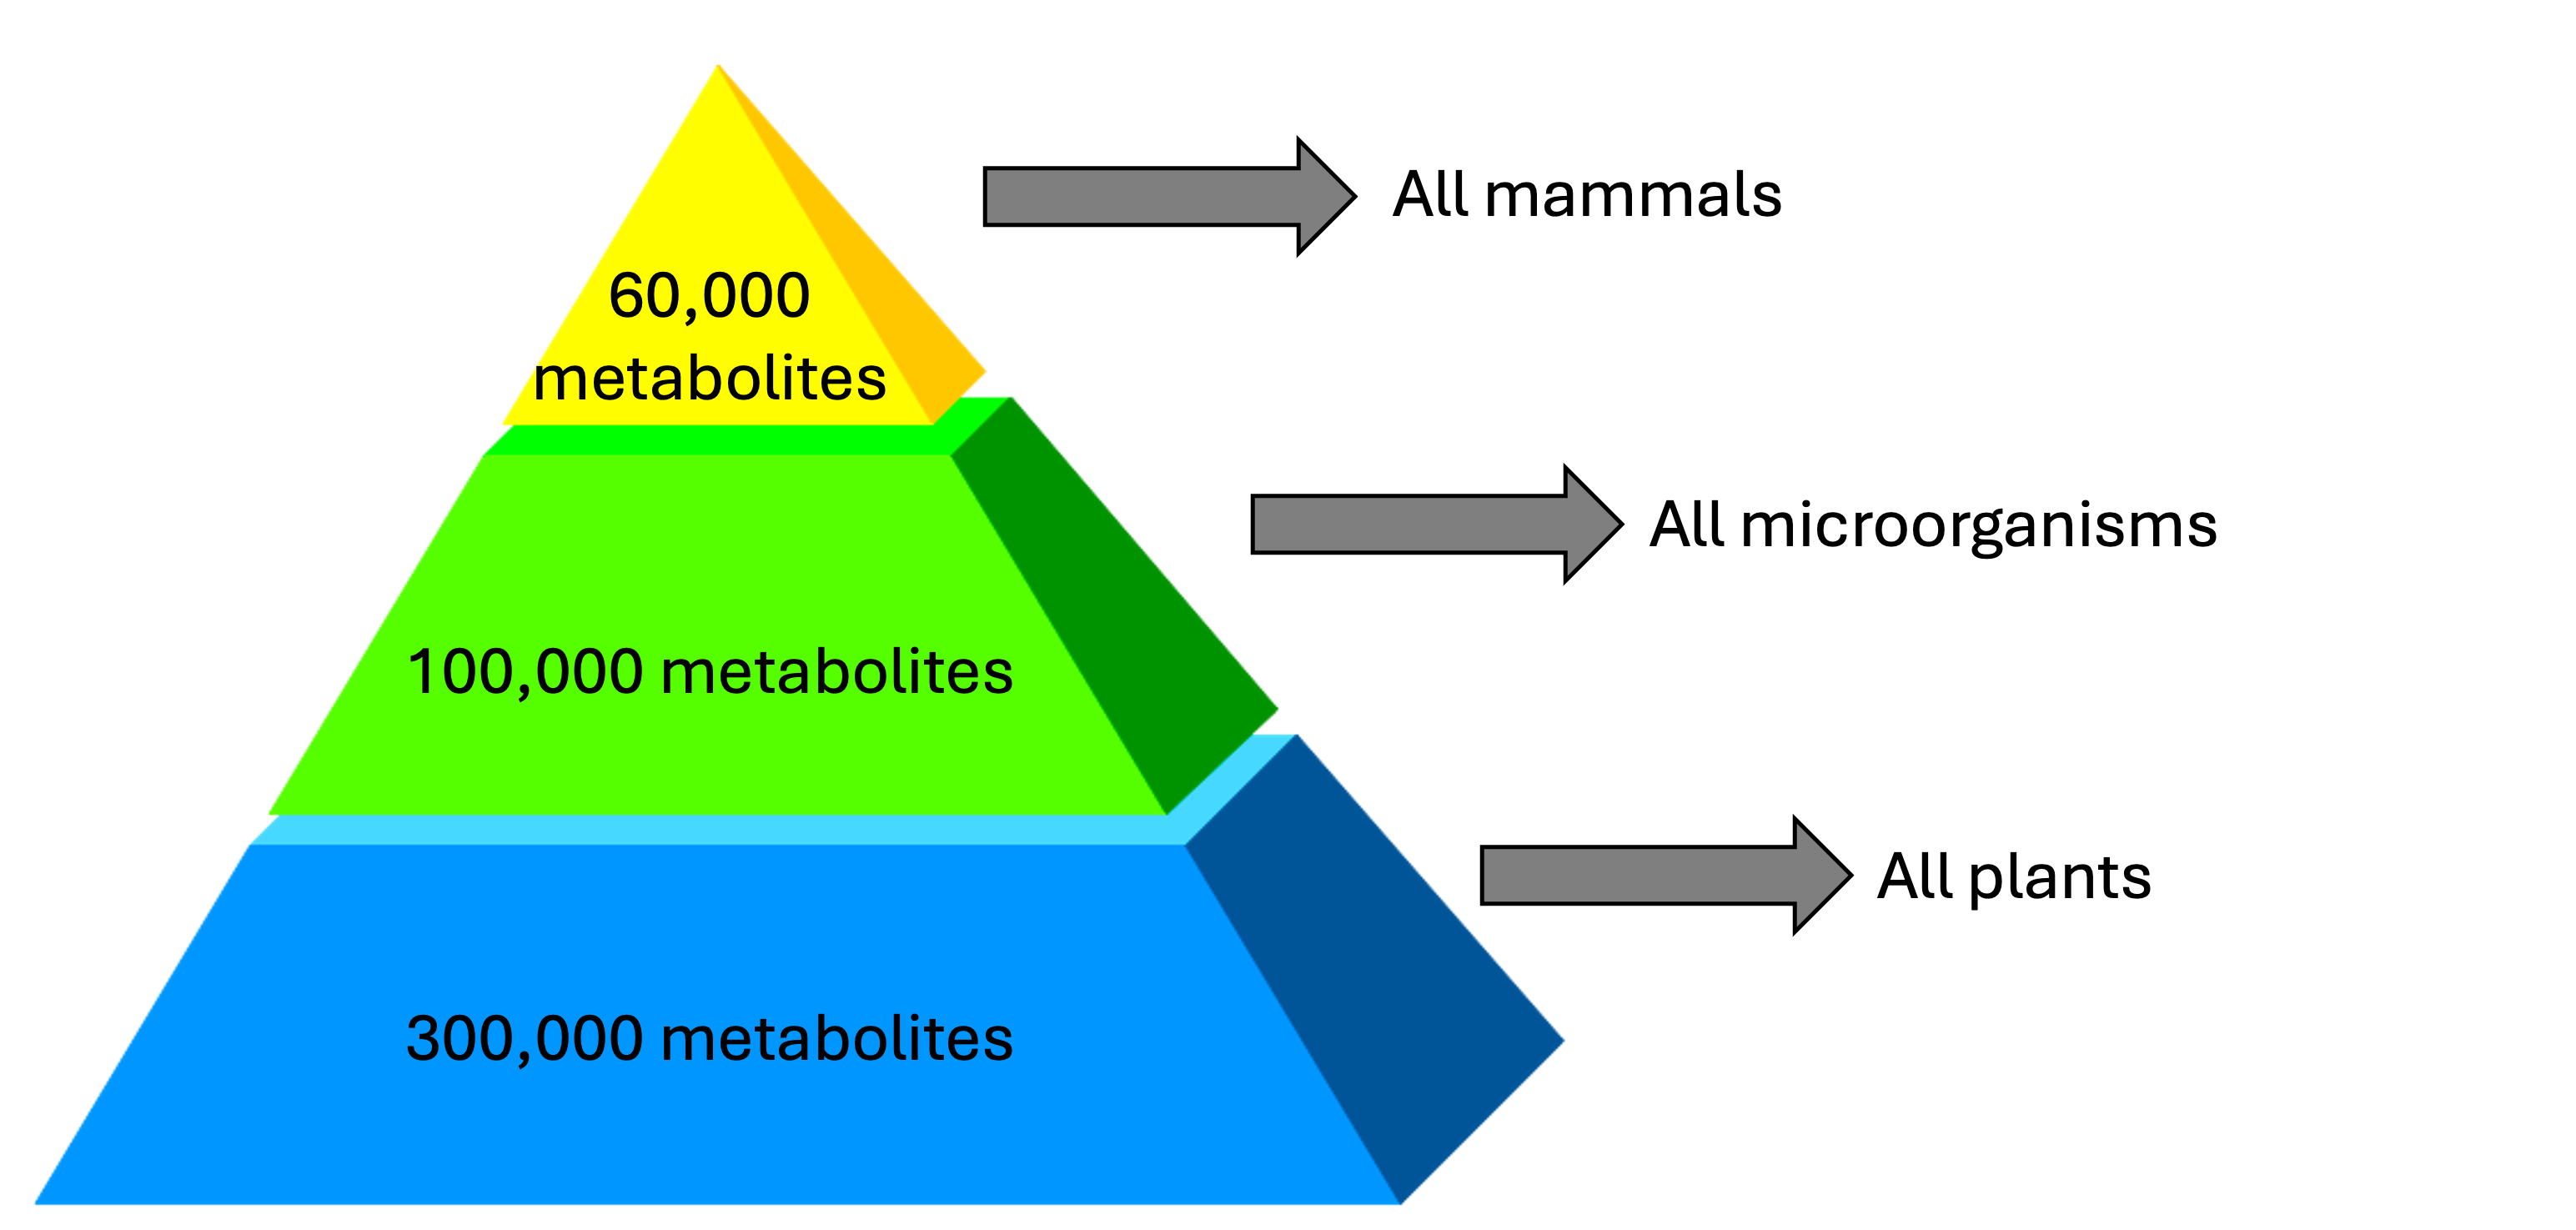
The metabolome is really BIG!
The metabolome is constantly changing

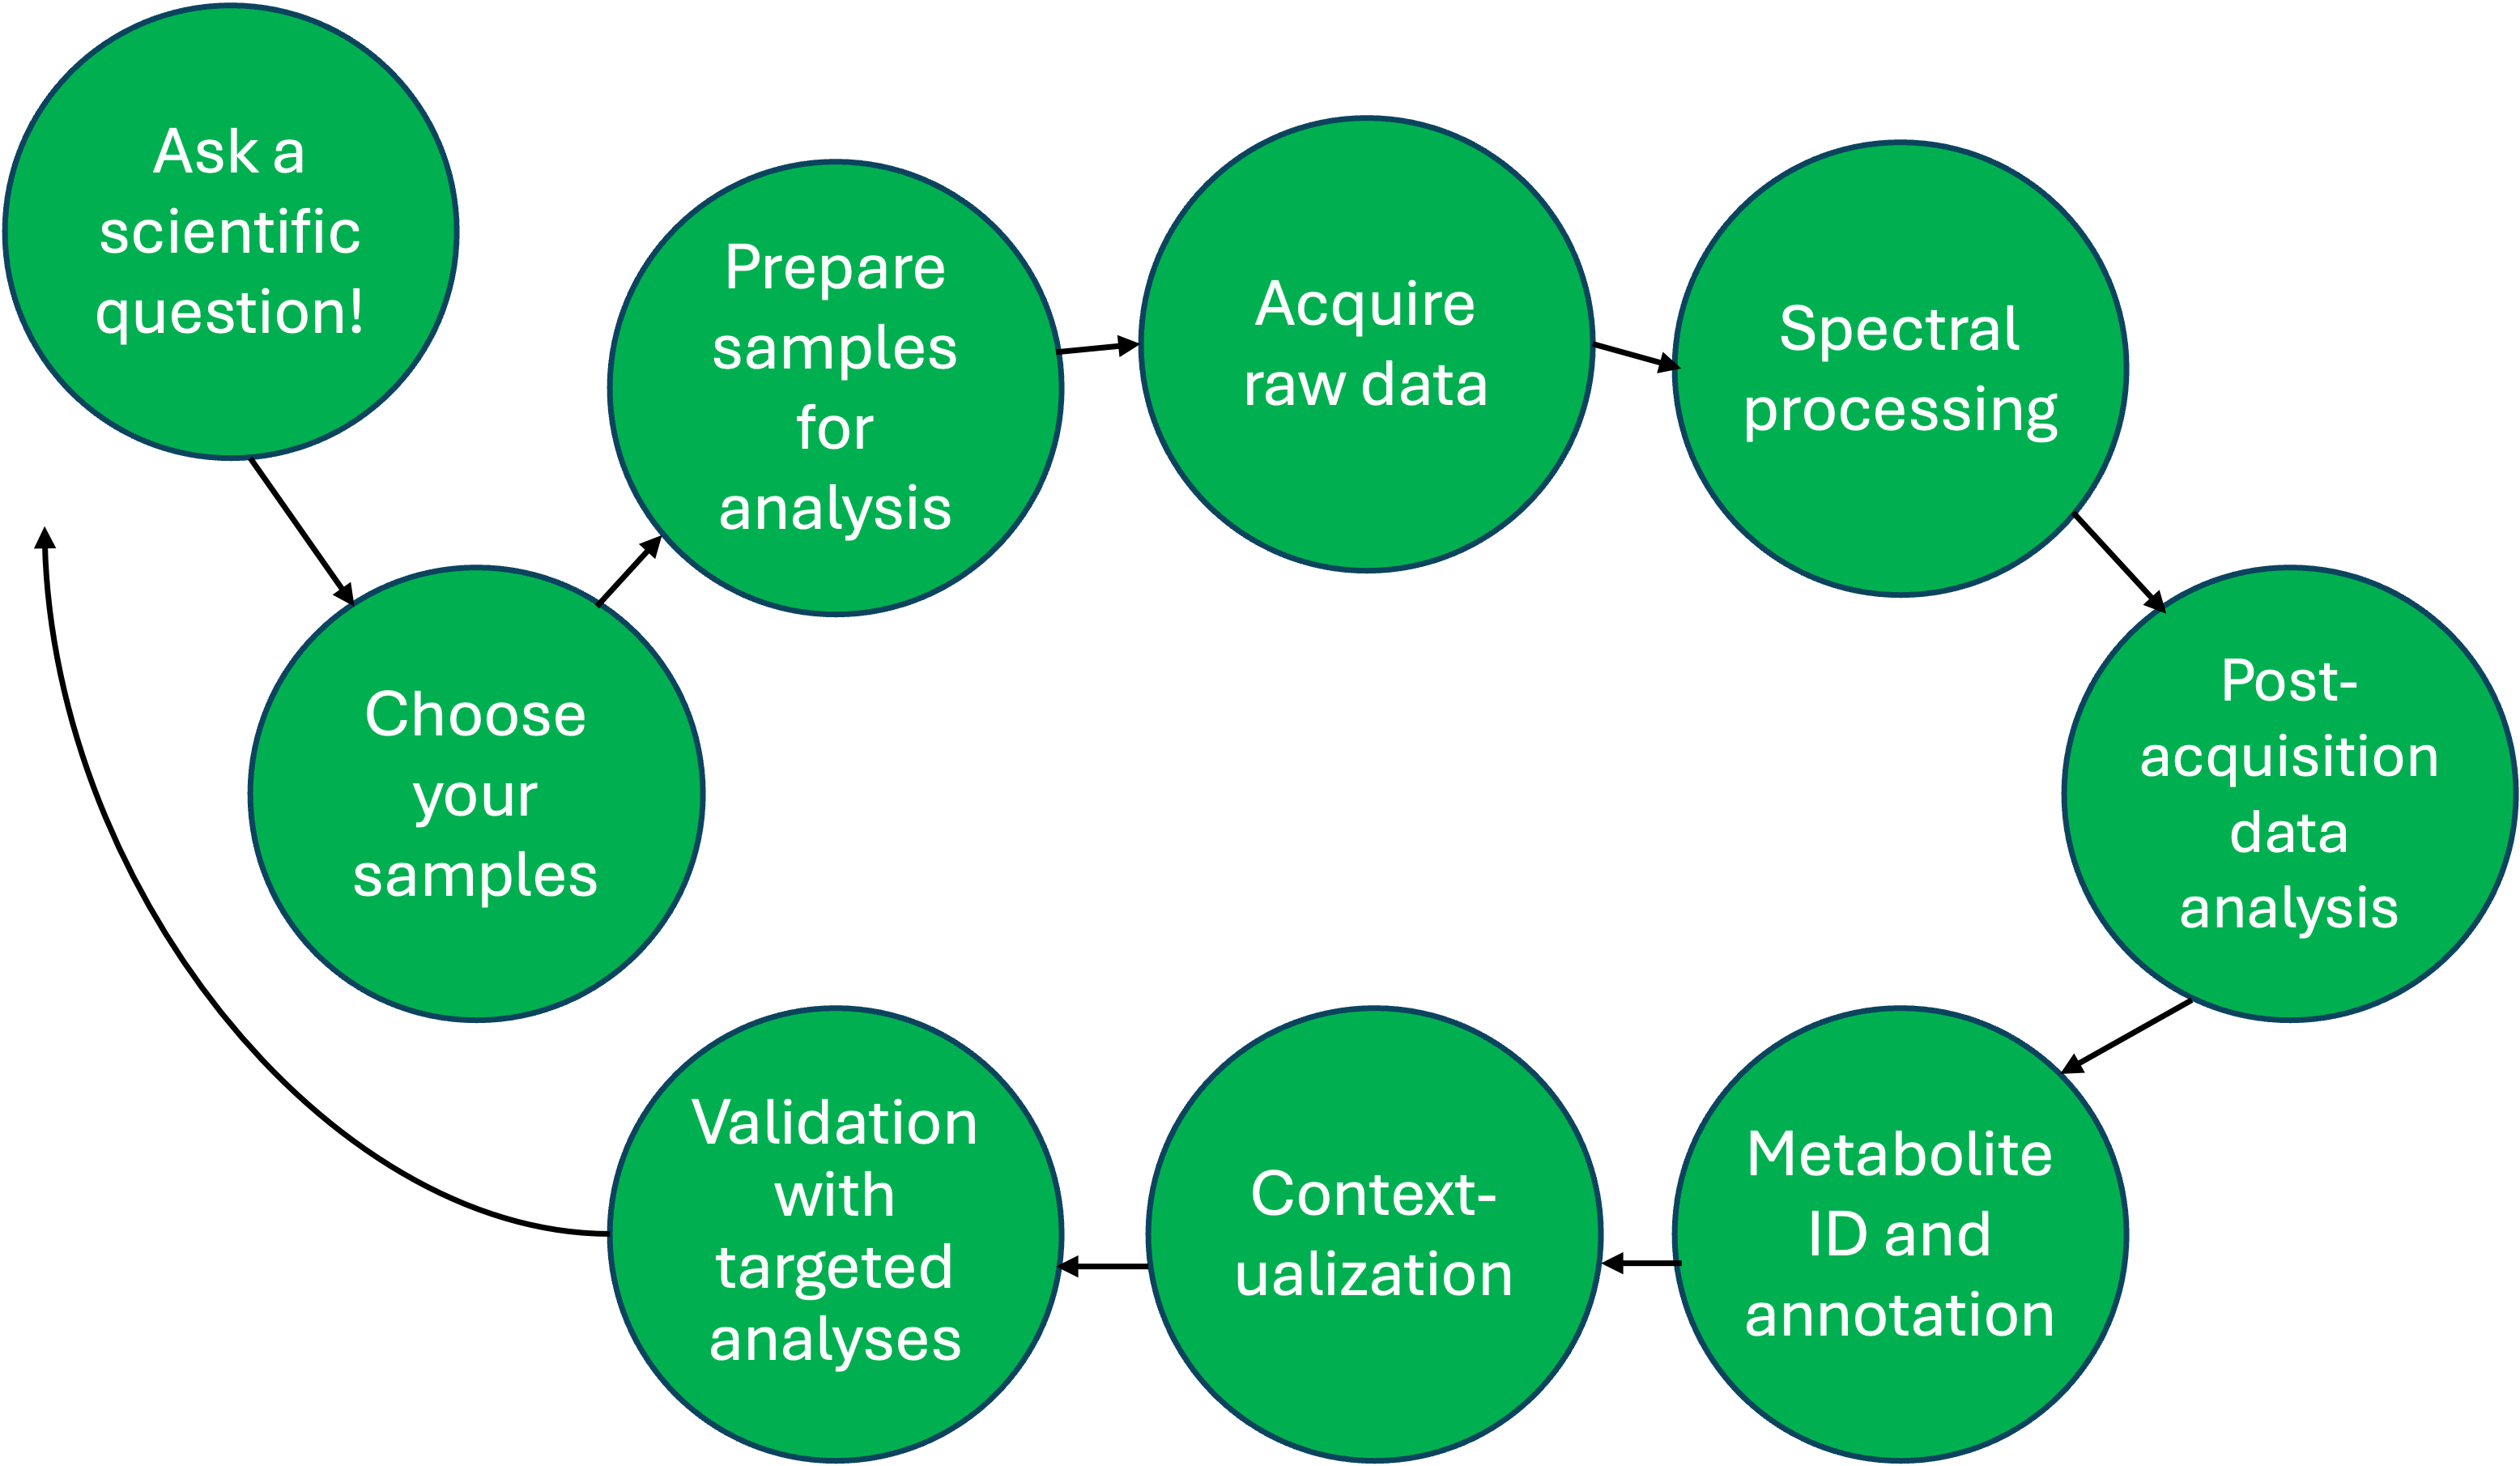
Metabolomics workflow
Metabolomics is a comparative analysis
- What can food scientists use metabolomics for?
- If you have specific compounds of interest, develop a targeted method!

What do we want to compare?
- It’s critical to select comparable samples as our approach is comparative.
- Foods: plants, animal products, raw ingredients, finished product
- Biological sample: plasma, urine, tissue, other fluids, cells
Preparation dictates compounds detected
- You can only detect what you present to an instrument for analysis
- Sample prep depends on intended method of analysis (e.g., water extraction, polar compounds; non-polar extraction, non-polar compounds)
- Dilute, centrifuge/filter, inject (e.g. urine, juice, olive oil)
Collect comprehensive metabolite data
3 most popular methods for analysis:
- Liquid-chromatography, mass spectrometry (LC-MS)
- Gas chromatpgrahy, MS (GC-MS)
- Nuclear magnetic resonance spectroscopy (NMR)
All methods have benefits and drawbacks
Convert spectral data into feature table
- From raw spectra, ions are selected, chromatograms drawn, peaks detected, masses and retention times aligned, features dereplicated
- Result is a data file that includes m/z, retention time, compound identifier (usually mz_rt), and relative abundance of each feature in each sample
- With MZmine, samples are columns, features are rows
Use statistics and chemometrics to understand group differences
- Significance testing (e.g., t-test, Wilcoxon rank sum test, ANOVA)
- Unsupervised analyses (e.g., PCA, hierarchical clustering)
- Supervised analyses (e.g., PLS-DA or PLS-R, random forest)
What metabolites do we have?

- Searching publicly available databases (e.g., HMDB, Mass Bank of North America (MoNA), GNPS) at the MS1 and MS2 level
- Conduct MS/MS experiments
- Comparison with authentic standards
Putting findings into a broader context
- Understanding which metabolic pathways are most deregulated
- Typically for enzymatic pathways
- Requires compound IDs (a big limitation)
Ensure findings are real and reproducible
- Mass spectrometry is not inherently quantitative (i.e., if the intensity of analyte A is higher than analyte B, it doesn’t necessarily mean there is more of A than B)
- Knowing the absolute concentration allows comparison with literature/other data
- Validation in a separate sample set ensures robustness
Metabolomics workflow
